October 2024 – March 2025
Out in the vast green fields, every crop has its own “expression” — its leaf area, color, and height silently reflect how it responds to the environment. My task was to become a “translator,” using algorithms and models to understand this silent language.
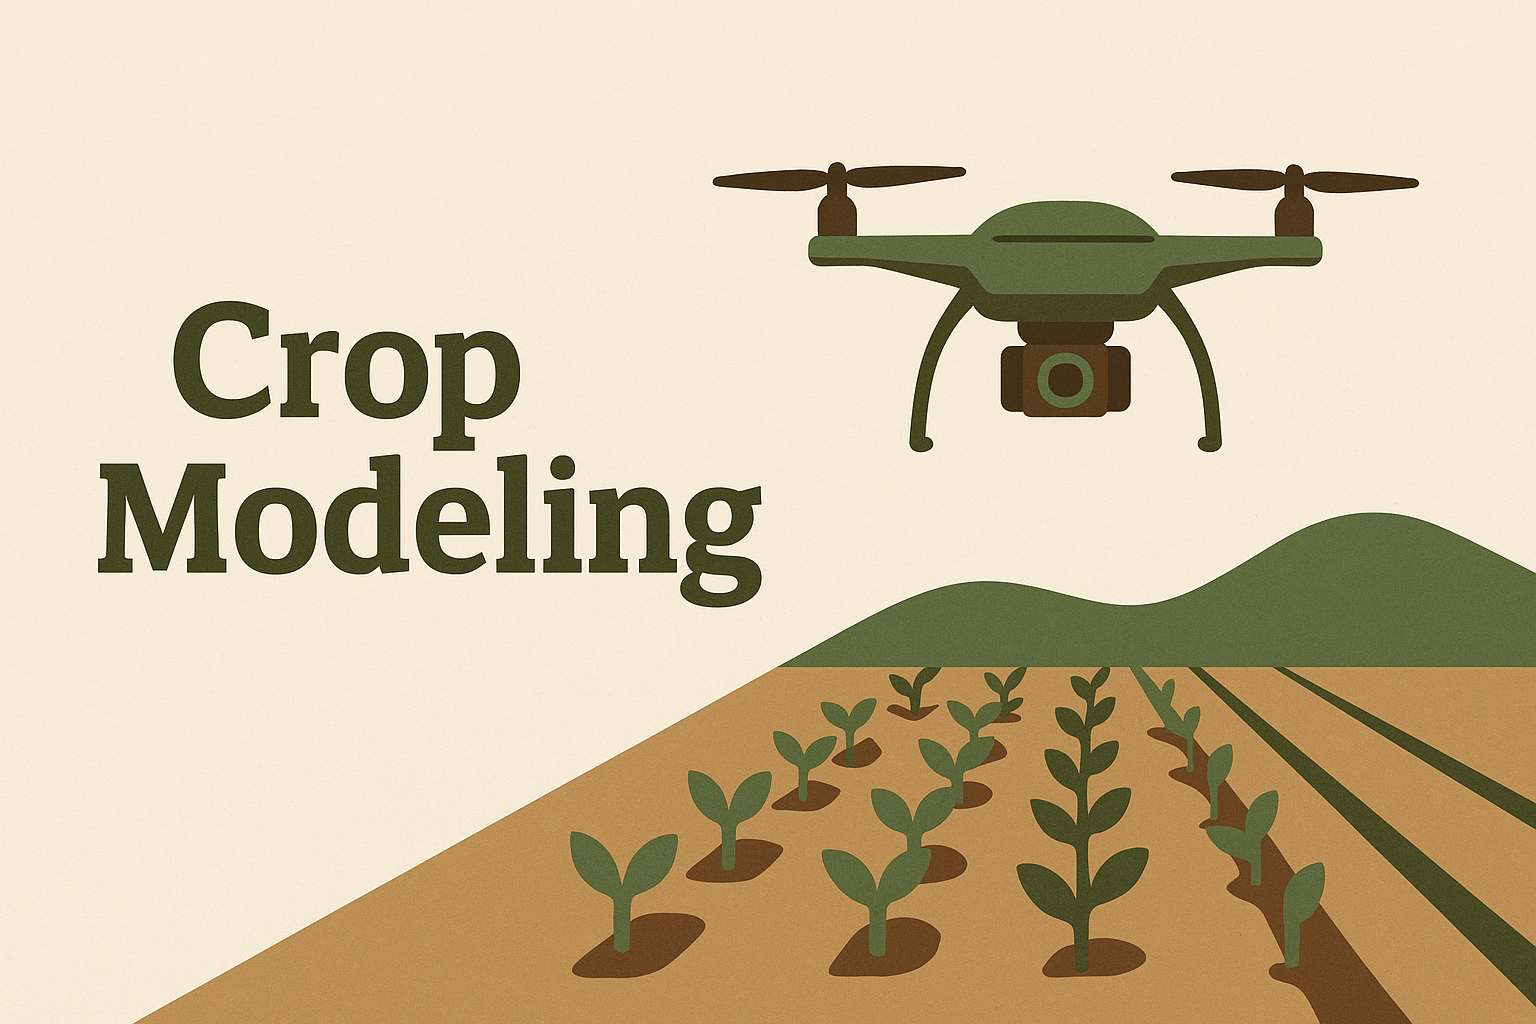
The core goal of this project was to build a quantitative relationship between pest and disease dynamics, the Leaf Area Index (LAI), and final yield. Rather than dealing with a single data stream, I worked with a complex system: spectral images captured by UAVs (different bands reveal different physiological states), precise laboratory measurements, and on-site field sampling data.
My work began with the most fundamental and crucial step: data fitting and model optimization.
From imagery to data: I wrote code to process spectral images and convert multi-band information into quantitative indicators of crop health. It felt like conducting a “CT scan” of crops — revealing their internal conditions beneath appearances.
Dialoguing with classic models: Instead of reinventing the wheel, we adopted multiple mainstream crop growth models, both domestic and international. However, direct application resulted in unsatisfactory prediction accuracy due to local variations in soil, varieties, and microclimates.
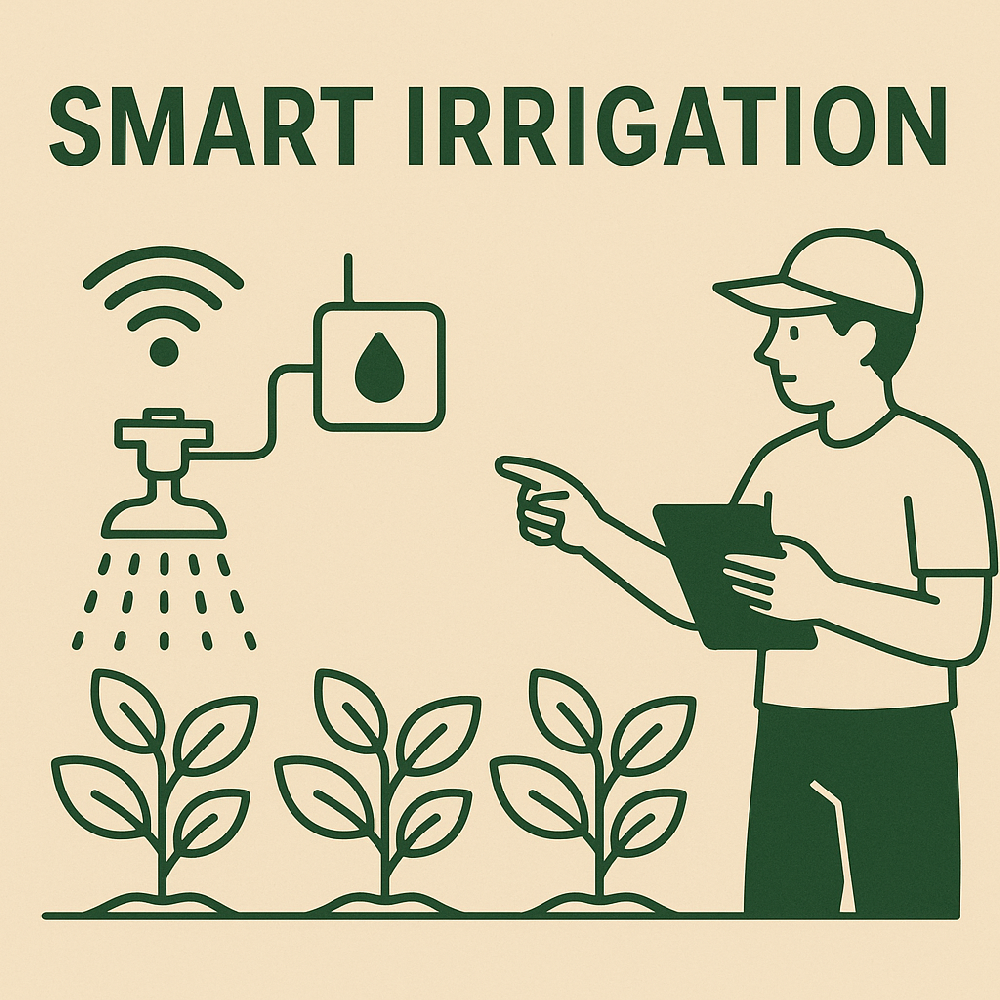
Untangling variables: The biggest challenge was to separate intertwined factors. Temperature influences LAI, which in turn impacts yield. Simple correlation could be misleading. I designed a multivariate analysis pipeline to isolate the independent effects of temperature, light, and LAI on yield. We found that during critical growth stages, LAI was a more direct driver of yield than temperature, shifting our management priorities toward optimizing canopy leaf area.
Insights through time: Using decades of historical data, I ran the models to analyze trends in planting area and yield over time. The goal was to identify which parameters dominated yield changes in different periods. This dynamic, historical perspective allowed us to pinpoint key drivers at different stages, making predictions more forward-looking.
This journey taught me that while humans are small in the face of nature, by building these digital “crystal balls,” we can uncover its patterns more clearly — and learn to work with it more scientifically.

Comments